Remote sensing improves prediction of tropical montane species diversity but performance differs among taxa
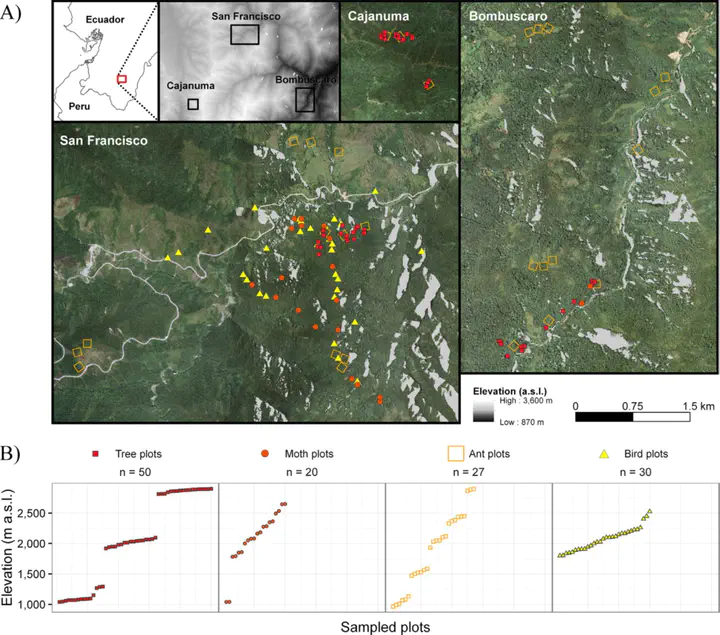 Study area and sampling plots of studied taxa
Abstract
Texture information from passive remote sensing images provides surrogates for habitat structure, which is relevant for modeling biodiversity across space and time and for developing effective ecological indicators. However, the applicability of this information might differ among taxa and diversity measures. We compared the ability of indicators developed from texture analysis of remotely sensed images to predict species richness and species turnover of six taxa (trees, pyraloid moths, geometrid moths, arctiinae moths, ants, and birds) in a megadiverse Andean mountain rainforest ecosystem. Partial least-squares regression models were fitted using 12 predictors that characterize the habitat and included three topographical metrics derived from a high-resolution digital elevation model and nine texture metrics derived from very high-resolution multi-spectral orthophotos. We calculated image textures derived from mean, correlation, and entropy statistics within a relatively broad moving window (102m×102m) of the near infra-red band and two vegetation indices. The model performances of species richness were taxon dependent, with the lowest predictive power for arctiinae moths (4%) and the highest for ants (78%). Topographical metrics sufficiently modeled species richness of pyraloid moths and ants, while models for species richness of trees, geometrid moths, and birds benefited from texture metrics. When more complexity was added to the model such as additional texture statistics calculated from a smaller moving window (18m×18m), the predictive power for trees and birds increased significantly from 12% to 22% and 13% to 27%, respectively. Gradients of species turnover, assessed by non-metric two-dimensional scaling (NMDS) of Bray-Curtis dissimilarities, allowed the construction of models with far higher predictability than species richness across all taxonomic groups, with predictability for the first response variable of species turnover ranging from 64% (birds) to 98% (trees) of the explained change in species composition, and predictability for the second response variable of species turnover ranging from 33% (trees) to 74% (pyraloid moths). The two NMDS axes effectively separated compositional change along the elevational gradient, explained by a combination of elevation and texture metrics, from more subtle, local changes in habitat structure surrogated by varying combinations of texture metrics. The application of indicators arising from texture analysis of remote sensing images differed among taxa and diversity measures. However, these habitat indicators improved predictions of species diversity measures of most taxa, and therefore, we highly recommend their use in biodiversity research.